A viral video and our take on it
The video in question is by a finfluencer. He put out this video a few days back suggesting that US markets are showing signs similar to the Great Depression of late 1920's and Dot Com Bubble of 2000 and can correct by over 30-40%, ripple effect of which will be felt in Indian markets.
We believe finfluencers, while not licensed by SEBI to provide financial advice, play an important role in creating awareness, and importantly, in stirring up the pot. The video has its expected fair share of “over-simplifying and generalizing a deeply complex subject”. However, its underlying message is quite relevant, especially given the recency bias amongst investors.
Quoting experts, he gives 3 reasons:
- Valuations of US markets are similar to 2000 (the Dot Com bubble - markets corrected by close to 50%) and 1929 (Great Depression - markets corrected by 85%), i.e. they are as expensive as they were then. He uses a specific metric - Shiller PE ratio.
- Banks pay higher interest rate for longer term FDs - this is the norm. However, until recently, it was the reverse in US where short term FDs were paying a higher interest than long term FDs - referred to as yield curve inversion.
- How just 7 companies (the Magnificent 7 - Apple, Amazon, Alphabet, Meta, Microsoft, Nvidia, Tesla) are dominating the US stock markets.
Do we agree that US markets can correct by 30-40%?
Let us break it down. First & foremost - the aforesaid are not the cause. They are the manifestations or signs (or the effect) of something deeper (the real cause). Going into the real cause will however need us to go down the rabbit hole of how the world has conducted trade over the centuries. From the barter system to the modern-day fiat-currency system and how the modern-day system, which allowed countries to print their currencies with “gay abandon”, without the backing of any asset (pre-1970, the asset used to be Gold), is under serious threat. We will need to get into:
- How it used to operate in the period post the WW2 and late 1960's (what was known as the Bretton Woods system).
- How it abruptly changed in early 1970's due to a decision taken by the then president of USA.
- How that new system both caused, and was later used, to bail the world out of a financial crisis in 2008.
- How an alternate system (Bitcoin) was created in response (almost as an act of rebellion) to the 2008 financial crisis.
- How post-Covid governments (all over the world) had no option but to bail its citizens out of job losses and economic shut-down.
- How that system took its biggest knock when USA imposed sanctions on Russia after latter invaded Ukraine, and how Trump 2 era's policies have led it to its most vulnerable state - the proverbial final nail in the coffin?
That system was based on pure faith on the currency of the World's largest economy - the US Dollar and on 3 core principles:
- Holding U.S. treasury is as good as holding Gold. See below chart - for the first time since 1996, foreign central banks are holding greater share of Gold in their reserves than U.S. treasuries.
- USA's hegemony refers to the political, economic, military, and cultural dominance of the United States over other nations. The world is now transitioning from what was known as unipolar world (dominance by one country) to a multi-polar world. Which while good, is a decisive change and will naturally have implications.
- USA will run trade deficits. Hence, it will owe money to foreign central banks, which the latter will keep in US dollar. USA under Trump 2 has made its intention clear of reversing this.
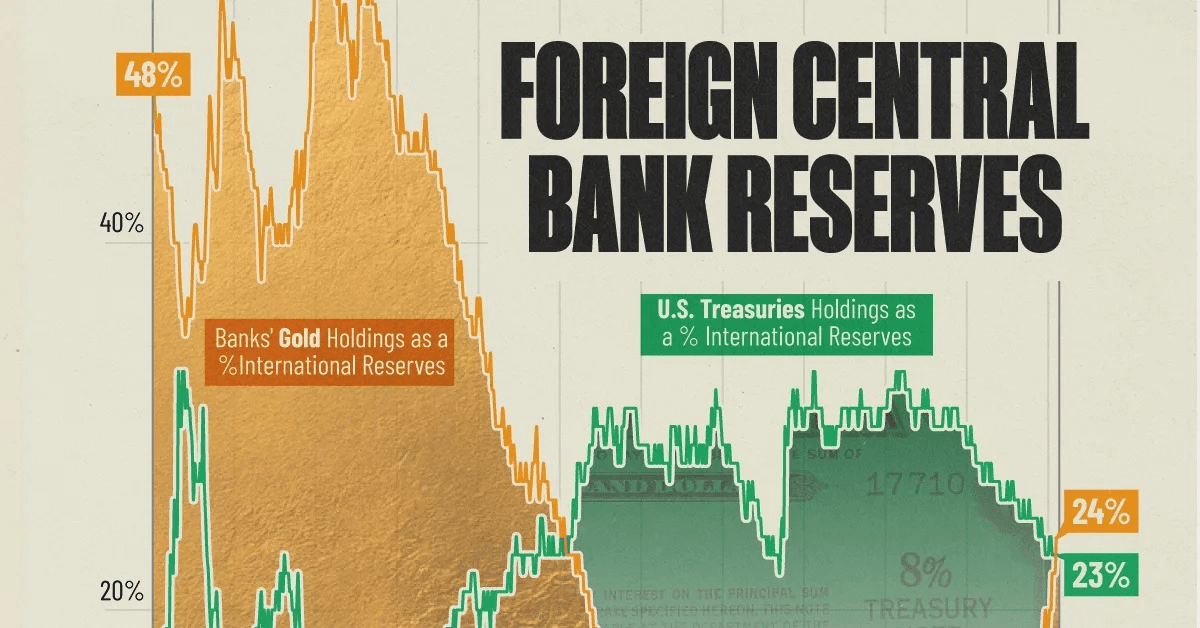
It would be correct to conclude that the modern-day fiat currency system, was built around an unwritten understanding, which in turn was founded around a delicate balance of geo-politics. It remarkably survived the Cold War & the two financial hiccups in between - 2000 dot com bubble & 2008 financial crisis. However, with the rise of China, aftermath of Russia-Ukraine War, rise of anti-immigrant sentiment and protectionist regimes in many countries, that balance is under threat. If, and when, it ruptures, it can upend the US economy, the US dollar, the US markets, and the world.
Net-net, what are we saying?
We do not know. It is hard to even say whether it is a merely a question of when, and not if. While the signs are ominous, it is important to remind oneself that a lot rides on the current system. Also, would not those who are in charge, know all this? They definitely do and are working as per a plan. The answer to this question really holds the key - will their plan work or will it make things even worse for US?
The few experts we follow, and who share our concerns on the state of affairs - some do suggest that it is not a question of if, it is just a question of when. However, they too warn that it is impossible to predict when a correction takes place. A very well-known expert recently said it could take 3, 5 years, even longer.
John Maynard Keynes - one of the most famous economists of modern times, famously said that "the market can stay irrational longer than you can remain solvent". This means that market irrationality can last longer than an individual investor can withstand the financial losses that result from betting against it. For example - Alan Greenspan, who was the Chairman of Federal Reserve (USA's central bank) had issued a warning in December 1996. He had warned of irrational exuberance in the stock markets and that investor optimism was causing a bubble in the share prices. What happened next is a very interesting case study of the limits to the intellectual capabilities of even specialists & experts (leave alone finfluencers) of correctly predicting the "when".
Markets did correct – by more than 50%. However in 2000-01.
In the intervening period:
+31%
Year 1997
+27%
Year 1998
+19.5%
Year 1999
Markets doubled!
Let us see how the markets responded in the decade the monetary system previous to today's was upended. This is when the USA broke out of the Bretton Woods system, in 1971. The subsequent decade saw considerable volatility. USD 100 invested at the beginning of the decade was worth 117.2 by the end of the decade - an annualised return of just 1.6%. However, a re-balancing policy, if implemented, would have worked really well - both in 1974 and 1976.
| YEAR | S&P 500 Yearly return | Value of @ 100 |
|---|---|---|
| 1970 | 0.10% | 100.1 |
| 1971 | 10.79% | 110.9 |
| 1972 | 15.63% | 128.2 |
| 1973 | -17.37% | 106.0 |
| 1974 | -29.72% | 74.5 |
| 1975 | 31.55% | 98.0 |
| 1976 | 19.15% | 116.7 |
| 1977 | -11.50% | 103.3 |
| 1978 | 1.06% | 104.4 |
| 1979 | 12.31% | 117.2 |
| Annualised return over 10 years | 1.6% |
Net-net, the signs are indeed ominous. And it merits some actions at everyone's end. However, there is no standard cookie-cutter action, as the finfluencer seems to be suggesting. And that is where one needs to draw a line between finfluencers and specialists. The finfluencers do their job by stirring the pot - the next step is a detailed discussion & debate between you and your advisor, followed by necessary actions, if any.
From recency bias to building resilience
Should things get upended in the US and have a ripple effect on the world, including India - the one thing which worries us most is this phenomenon of recency bias, which has led to two things: One - it has gotten investors used to a certain return on their equity investments. Two - it has led to investors over-extending themselves on their equity exposures. We are not suggesting that this bias is all-pervasive but given human nature, it is a very natural phenomenon.
Before we elaborate on above, we suggest you do one exercise: please check your 3-year annualized portfolio returns from equity assets as on today, (stocks, mutual funds, PMSs) and compare it with your 2-year annualized portfolio returns as of a year back. You would notice a reasonable correction. Why has that happened? Indian equity markets have not corrected in the last 1 year. In fact, they are marginally up. Then why have the annualized returns come off?
Let us understand this with an example: Say Rs. 100 were to become 151 in 3 years - this implies a simple return of 17% per year. 151 minus 100 = 51. 51 / 100 = 51%. 51% / 3 years = 17%. Now say in 4th year, there is hardly any growth, and 151 grows to 155. This means Rs. 100 has grown to 155 in 4 years. This implies a simple return of 13.75% per annum. Assume there is marginal growth in 5th year as well and 155 grows to 160. This means Rs. 100 has grown to Rs. 160 in 5 years. This implies a simple return of 12% per annum (down from 17%). This phenomenon is known as time-correction - where your annualized returns come down even though there were no price correction in the markets.
Our take is that if the modern-day fiat currency system upends, while it will lead to ripple effects, Indian stock markets are more likely to undergo a time-correction rather than a deep value correction. Our massive population, a burgeoning middle class, and our relatively stable macro indicators could cushion any ripple effect. Our sheer size, while making governance a complex task which in turn prevents us from being a break-out economy, also acts as a safety valve. In fact, in the near term, any reversal of tariffs by USA could lead to an up-cycle.
However, even time-corrections can be deeply frustrating, as it can deplete medium-to-long-term returns, which can lead to errors of judgment at an investor's end. Hence, it is useful to:
- Keep one's return expectations from equity assets near to the long-term averages, perhaps a notch lower.In our proprietary Risk Return Readiness framework, we have reduced our equity return number from 11% post-tax to 10% post-tax OR from 12.5% pre-tax to 11% pre-tax.P.S. - this assumes a predominantly large cap portfolio. A portfolio with a mix of mid & small cap should theoretically give higher returns.
- Remember that when you invest in equity, you are essentially taking ownership in a business, you are betting on an entrepreneur. While markets will do their usual song & dance, the business, the entrepreneur will continue to strive to grow the business. A systemic breakdown could even impact businesses but that is when enterprise comes into play. As long as you have bought into enterprising managements and / or selected a few fund managers who have a long track record and therefore have witnessed several market cycles, patience will pay off.
- Assess if you are over-extended into equity assets? It will be useful to go back to the drawing board and assess both your Risk Tolerance and your cash-flow situation.
- Risk Tolerance (emotional readiness to withstand market fluctuations) is assessed through a psychometric questionnaire. At Serenity, we give this exercise a lot of seriousness. In fact, we are in the process of re-designing our questionnaire (to keep up with changing times) and will shortly be reaching out to our clients to do a fresh exercise.
- Assessing your cash-flow situation is equally critical. We prefer that after factoring in cash inflows from other sources, you should be well-covered for net cash-outflows for 5 years. 3 years at the minimum. These funds need not be all deployed in liquid assets. There are other avenues / strategies which are less volatile than equity and can give a return higher than liquid funds. What you do not want is a situation where you are forced to liquidate your equity assets (to meet a cash outflow) in depressed markets.
- Assess if you are truly diversified?
- Currency – a typical question could be: would not a sharp depreciation or a collapse of USD cause INR, which is pegged to USD, to appreciate? And in any case, does it matter to us Indians, who are earning, investing, and spending (by & large) in India?A collapse would mean a sharp, sustained, and confidence-destroying fall in the value of the USD against other major currencies like the euro, yen, pound, yuan, etc., and in an inter-connected world, any major disruption in global currency markets will impact INR. Even if assuming India's macro indicators continue to be stable, the USD is still the central pillar of the global financial system. INR might strengthen vs USD but fall against other currencies. Each of us will have some expenses (foreign travel, higher education for example) in foreign currency. At the least, to that extent, diversification is a smart thing to do.
- Country – while India's relatively stable macro-indicators give us confidence, it is always prudent to spread country risk. Concentration of investments is good until it is not. Also, why not bet on entrepreneurs across the world?
- Asset Class – while equity is our preferred growth asset amongst the financial assets, the very nature & design of equity markets make it susceptible to very high volatility. There are competing asset classes (lower on return but lesser volatile) and variants of equity which can be considered.
- Single stock or sector – Concentration in one stock or sector in many instances is by default (by virtue of ESOPs/RSUs) and could comprise a significant part of one's portfolio. It is understandably not an easy decision to diversify in such instances but given the emerging world scenario, it is prudent to consider some diversification.
We also find concentration of a single stock and sector in several portfolios due to legacy reasons and what can hold one back from diversifying is: ‘what-if the stock does better than what we have diversified into?’ There are no guarantees. However, it is smart to remember that diversification is the only free-lunch available in investing and you will do well to make full use of it. - Currency – a typical question could be: would not a sharp depreciation or a collapse of USD cause INR, which is pegged to USD, to appreciate? And in any case, does it matter to us Indians, who are earning, investing, and spending (by & large) in India?
- Tune in to narratives but do not blindly fall for them.You would be hearing a lot in these past few months about hard assets and why, given the world scenario, it is prudent to move to hard assets (real estate, physical gold) from financial assets (equity, bonds). Real Estate and gold feel tangible. They are physical, familiar, and have long histories tied to wealth preservation. Additionally, given that many central banks are increasing their holdings in Gold, given the potential of Gold becoming the de-facto peg for currencies - the yellow metal has been in the spotlight.Part of the appeal comes down to psychology. Homes are often associated with stability, success, and security. Gold has traditionally been viewed as a safe haven, especially during times of uncertainty and rising inflation. Holding a piece of gold or walking through a house you own can give you a real sense of ownership. It's almost like you can feel the value in it.However, over long periods, stocks have historically outperformed both real estate and gold. Hence, leaning too hard on hard assets could backfire, in the long term. They serve a purpose, but not at the expense of balance.
- Keep generating wealth, the real way.“If you are a butcher focus on making money selling meat.
If you are a dentist focus on making money by drilling teeth.”*In all this, it is also important to remember how real wealth is generated - through enterprise, through craft, and that process must continue as long as it can.
*the above is a quote we heard from a recent interview of Nassim Nicholas Taleb. The Lebanese American essayist, statistician, former option trader, risk analyst, and aphorist. The man who coined the word black swan.
In conclusion
While it is important to know what is happening, what can happen, assess the probabilities of it, there is only so much one can do to protect one's investments from uncertainties, and that too of this scale and complexity.
It is also important to maintain a reasonable balance between wealth preservation and growth. Remember that both do not go hand-in-hand.
Try to get over the recency bias. And build resilience. Both within & in your investment portfolio.
Glossary
Recency bias in markets is the tendency for investors to place too much weight on recent events and market performance when making investment decisions. This behavioural finance phenomenon can lead to poor, impulsive decisions based on incomplete information, as investors mistakenly assume recent trends will continue indefinitely.
Yield curve inversion is an abnormal market condition where short-term government bonds offer higher yields than long-term bonds. This unusual, downward-sloping curve signals that investors expect lower interest rates in the future, typically in response to an anticipated economic slowdown or recession.
The Shiller P/E ratio, also known as the Cyclically Adjusted Price-to-Earnings (CAPE) ratio, is a stock valuation metric that smooths out market fluctuations by dividing the current stock price by the average inflation-adjusted earnings of the previous 10 years. It helps investors determine if the market or a specific stock is overvalued or undervalued over the long term. Popularized by economists Robert Shiller and John Y. Campbell, it was developed to provide a more stable valuation measure than the traditional P/E ratio, which can be volatile due to short-term business cycle effects.
The Bretton-Woods system: Prior to Bretton-Woods system, there was the Gold Standard - a system under which nearly all countries fixed the value of their currencies in terms of a specified amount of gold, or linked their currency to that of a country which did so. The gold standard was abandoned because its rigid system of fixed exchange rates prevented governments from using expansionary monetary policy to manage economic downturns, like the Great Depression. The demands of financing major wars, particularly World War I, also strained the system, leading to its gradual collapse and eventual abandonment by countries seeking more flexible economic control. It became clearer during the Second World War that a new international system would be needed to replace the Gold Standard after the war ended. The design for that new system was drawn up at the Bretton Woods Conference in the US in 1944. US political and economic dominance necessitated the dollar being at the centre of the system. After the chaos of the inter-war period there was a desire for stability, with fixed exchange rates seen as essential for trade, but also for more flexibility than the traditional Gold Standard had provided. The Bretton Woods system was drawn up and fixed the dollar to gold at the existing parity of US$35 per ounce, while all other currencies had fixed, but adjustable, exchange rates to the dollar. Unlike the classical Gold Standard, capital controls were permitted to enable governments to stimulate their economies without suffering from financial market penalties.
Trump 2 – what is the Trump team doing & why - we are sharing couple of links from one of the Economist we follow. This is former Greek finance minister – Yanis Varoufakis. What we like about Yanis, even though he comes with his leanings (economic and political), is his ability to cut through the noise and ideological biases. Link 1 | Link 2
Rebalancing an investment portfolio means adjusting your asset allocation back to its original target percentage by selling assets that have grown disproportionately and buying assets that have lagged. This process helps manage risk and ensures the portfolio aligns with your financial goals and risk tolerance over time. For example, if a portfolio is meant to be 60% stocks and 40% bonds, but stocks perform well and now make up 70% of the portfolio, you would sell some stocks and buy bonds to get back to the 60/40 target.
A Black Swan is a highly improbable event with three principal characteristics: It is unpredictable; it carries a massive impact; and, after the fact, we concoct an explanation that makes it appear less random, and more predictable, than it was. The word was coined by Nassim Nicholas Taleb.
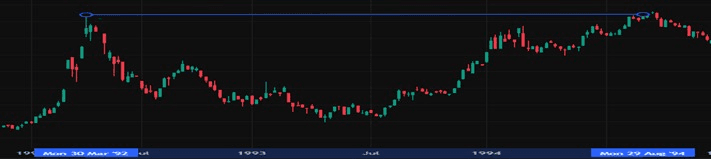
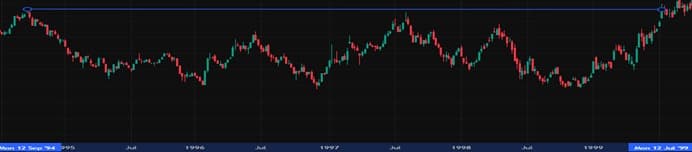
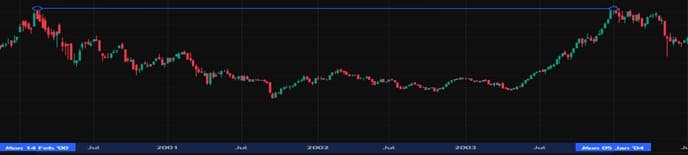
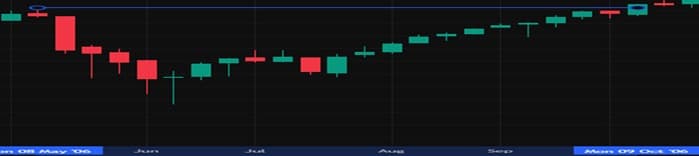
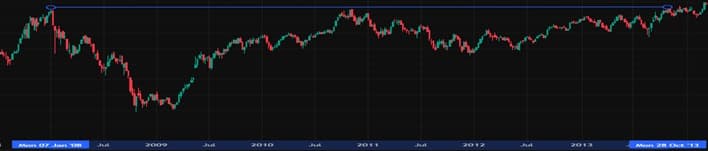
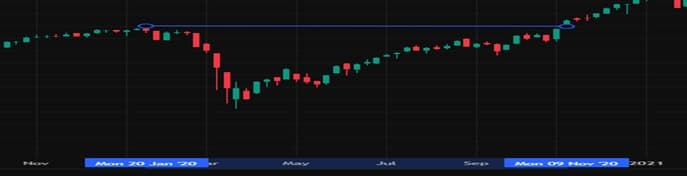
Six instances when Indian markets (BSE Sensex), in the last 35 years, fell by more than 30%.
Referred to as drawdowns (or price correction). The charts also mentions how many days it took to reach the previous peak again. Effectively if you were invested in the markets in this period - you made no return. The period was as low as 5 months, to as long as 5 years.
Disclaimer
Investment in securities is subject to market risks and investor should read all related documents before investing.
We do not guarantee performance or provide any assurance of any return.